

Macro update - what are the markets telling us?
Davide Sciannimonaco — 17 May 2022
We are not in the 70s nor in the dot-com bust but are navigating troubled waters. After one of the worst months in the history of the stock markets, we assess how our portfolios are positioned to withstand this storm and how they would behave once storm clouds give way to blue skies.
Bottom line
We went from boom to bust in just a few months. Markets are currently discounting that the worst is yet to come for the economy. We believe that at current levels the opportunity has never been brighter for long-term investors to seize on the cheap side investments that will shape our future.
We believe that while a recession might be unavoidable, the valuations of all of our portfolios are undemanding not only on an absolute basis but also when compared to larger indices such as the Nasdaq composite. Once the dust settles, the market would reward an active stock-picking approach rather than a passive index-tracking one.
What happened
In April, stocks posted one of the worst performances since October 2008 and September 2001. The Nasdaq Composite recorded the 12th worst monthly performance in its history with a 13.3% decline and its worst start of the year. The S&P 500 on its own posted the worst start to the year since 1939.
During the first two weeks of May, the sell-off continued in what could be seen as a global liquidation of any risky asset held by investors. The bond market was not any better as the first months were the worst of the last 150 years! Why does all this happen? Investors believe the Fed will not bring back inflation without causing a recession.
The markets had to swallow high inflation prints, the Ukrainian conflict, greater geopolitical and economic instability (notably on commodities), supply-chain issues, and a strict Chinese Covid-19 lockdown policy which hampers its growth. However, the main reason explaining this bloodbath in the markets is the fast rise of interest rates coupled with a Fed's quantitative tightening on the back of higher inflation (for which the main cause is skyrocketing commodity prices and supply chain disruptions). Financial markets are now forecasting a sharp slowdown in the economy in the next few months (on the back of a flattening yield curve, coupled with the Fed's hawkish stance) and lower companies' earnings, explaining the P/E compression we are currently seeing.
The Fed is still confident about the strength of the U.S. economy to weather cycles of interest rates rise, but what if everything further deteriorates and liquidity becomes an issue? Many other markets (corporate bonds notably) are experiencing the same pain as we do in the listed equities markets, and no asset seems to be safe except for real estate, but for how long still?
Impact on our Investment Case
As we wrote at the beginning of the year, our expectations for the first part of 2022 were for the markets to focus on the hawkishness of the Fed policy and the resulting impact of an already slowing economic growth. We mentioned stagflation (high inflation and negative GDP growth) as one of the main risks we did not want to see materializing as no single asset would be safe in such an environment. To date, this is not the case, but future economic data will be scrutinized to see if inflation drops together with a softer economic activity.
As the markets tend to anticipate policy action by about 6 to 9 months, we expect the Street to focus on the next phase of the Fed's monetary policy, which could be entirely at the opposite end of what we are experiencing today. The markets (through the Eurodollar) are already factoring in a rate cut to happen by the middle of next year. As a result, a rotation back into quality growth stocks is possible, particularly for those investors with a longer-term investment horizon focusing on solid trends, including demographics, globalization, aging, automatization, reshoring, etc.
The Fed does not care about growth. Really?
Officially, the Fed bets on a soft-landing of the economy, thanks to strong household spending and business fixed investments, and a robust job market. Its focus has turned to inflation. Doing so, it plays a dangerous game as the Fed needs to find the perfect equilibrium to avoid a crash of the real economy while getting rid of some excesses in the financial and housing markets and trying to contain price inflation.
Fed officials seek to convince investors that they are controlling the situation. However, we believe their monetary policy is bringing the country into a recession. The Fed's track record has been poor since the mid-'90s, when it first started to give guidance to the markets to overcome heightened volatility. In fact, the Fed always tightens too much until a recession appears.
The Fed knows that and has already tried to calm the markets by providing additional visibility on its next moves. Fed Chair Powell made it clear they do not intend to increase interest rates by 75bps in June. Moreover, it also announced the pace of the Fed's balance sheet reduction (a critical piece of uncertainty), squaring off the permabears thesis. The Fed expects to reduce its $9tn balance sheet by $47.5bn per month initially and $95bn after three months. Furthermore, the timing of the balance sheet's reduction, 1 June 2022, is also surprising. Why not start reducing the balance sheet immediately?
Delaying the shrinking of the balance sheet provides the Fed with the flexibility to adjust the size and timing of its balance sheet if supply chain disruptions in China or the Ukrainian conflict were to impact the U.S. economy more severely. The preliminary GDP growth in the first quarter was negative, and this was not "noise," as described by some analysts. Indeed, we have been preparing for a while for an economy that was slowing down.
Excluding the global war scenario, we believe that the worst for inflation might be behind us. Rising rates will eventually cool down the red-hot U.S. housing market. While home inventories saw their lowest YoY decline in April since the end of 2019, and prices went up by 14.2% YoY (and up by 32.4% since April 2020), mortgage costs doubled, and mortgage refinancing plummeted. As a result, homeownership is out of reach for many who will have no choice but to rent. New rents have increased by 22% YoY. The shelter component (rents) was the main reason for April's still high CPI (Consumer Price Index).
We also see that used car prices (a vital component of the rise in the consumer price index) are no longer soaring and would turn positive for a tamer inflation.
Is the Fed making a historical error?
In a recession, unemployment is likely to soar and savings to plunge. Some of the largest firms have already announced hiring freezes. Historically, when unemployment rises, inflation falls. Regardless of which angles we look at – employment, GDP growth, or inflation, the Fed cannot raise interest rates as announced. We believe that markets have gone ahead of themselves in forecasting so many rises by the Fed, suggesting the economy would be in a freefall.
The Fed and the U.S. Government were too generous (as opposed to other parts of the world) in helping everyone during the Covid-19 crisis. Liquidity abounded, and everyone saw their savings soaring to historical levels. It comforted people to buy stocks, homes, and cars during a period of extreme pressure on the supply chain of goods. Here is where inflation first appeared.
Supply-chain issues take time to adjust, and neither the Fed nor any Central Bank in the world can impact the supply of goods and services. The FED cannot say to China to open up its manufacturing activity nor it could say to Russia to stop the invasion of Ukraine. Thus, the Fed had no choice but to weaken the demand side by raising interest rates and eventually start quantitative tightening to reverse some wealth effect. As the U.S. markets already lost $10 trillion (about $31,000 per person in the U.S.) and $35 trillion were lost globally, some form of financial tightening has already occurred.
The political pressure is so intense about inflation in the U.S. that the Fed is in a position where it needs to show and proves it tackles the issue. However, the main risk for the markets is to see the Fed from being behind the curve to being ahead of it.
We believe that the current inflation is not structural and believe that the world remains in a deflationary spiral as the underlying forces such as aging and low birth rates dent the main driver for sustained inflation. Look at Japan, where the CPI was up by merely 1.2% YoY in April, despite the Yen depreciating by 25%.
While globalization did play a key role in bringing down inflation over the last 30 years, reversing it completely is in our view an impossible task as we have many regional economies such as Europe, Mercosur, Nafta, the Regional Comprehensive Economic Partnership which includes China, Japan, and Australia, and few others in the making.
You can bet that someone is always ready to benefit from arbitrage opportunities if prices vary too much from one region to another.
The U.S. is notoriously known for quickly reacting to events and changing its stance swiftly. We believe this time is no different, and once the supply chain stabilizes and demand for goods and services slows, a normalization to pre-Covid levels would occur. As economic growth continues to fall and recession risk rises, interest rates will reverse this recent jump as secular and cyclical pressure suggest the economy cannot cope with higher interest rates.
The impact of a strong U.S. Dollar in the U.S. and elsewhere
One of the most striking consequences of the rising rates in the United States can be seen in the forex markets. Investors have bought U.S. Dollars, betting on the interest rate differentials. Besides the Bank of England, other central banks have not begun to raise rates. Moreover, the Greenback is playing a safe-haven role.
A strong dollar is good for American consumers and foreign companies exporting to the United States. Given the U.S. trade deficit, it helps fight imported inflation, which is positive for the Fed's declared goal. The opposite is true for exporters (larger companies, most notably), as their imported income will be lower.
.png)
.png)
.png)
Around 40% of the revenue generated by S&P500 companies comes from non-U.S. sources, vs.18% for the Russell 2000 companies. Alphabet announced that its growth could have been 6% higher had the U.S. Dollar not appreciated since the beginning of the year.
For China (and some other emerging countries), a stronger U.S. dollar represents a significant issue for their monetary policy. With a Renminbi having sold off sharply (chart above), it will be difficult for the Chinese Central Bank to lower further its RRR (reserve requirement ratio) or the % of money Chinese banks should set aside. This ratio has already been cut three times in the past six months. The likelihood of seeing China relaxing its stringent anti-Covid measures to prop up its economy is getting stronger. Otherwise, it would mean taking the risk of further capital outflows, which would negatively impact its economy.
Growth vs. Value
Looking at Growth vs. Value, the latter has outperformed sharply over the past 15 months, but it has hardly recovered most of the underperformance over the past decade. Again, as the market tends to anticipate by 6 to 9 months future economic conditions, Value tends to outperform going into an economic crisis. At the same time, Growth takes the lead coming out of them. An inflection in the relative Growth/Value relative performance may indicate a bottom for the global economy.
Crises serve an essential function in the Schumpeterian "creative destruction" cycle: selection of the fittest. According to Schumpeter, economic cycles go through a phase of "creative destruction" where the status quo is shaken, and innovators can build and prosper on the ruins of the old system. Only innovative firms with strong products and sound balance sheets will come out stronger, ready to conquer the markets abandoned by failed peers. In all our portfolios, we focus on holding those companies that will survive the crisis and become stronger by buying out some of their failing competitors.

B2C vs. B2B – who stands to best weather the storm?
In the current economic slowdown and inflationary surge, we believe that consumers will suffer most, as disposable income is reduced by the higher cost of satisfying their primary needs, such as energy and food.
Companies will also feel the heat but will have to act to improve efficiency and productivity. It has always been the case in the past, and this time is no different. Even if they were to be reduced in absolute terms, investments will focus even more on what brings the most value to their clients. We always mention that we invest in the picks & shovels of the modern age, and this is even more the case today.
What are the similarities between today and the 2000/2002 dot-com bubble burst?
Many younger generations do not know what happened in the late 1990s and early 2000s. They know that the Nasdaq lost 78% from its peak in April 2000 to October 2002. The reasons that triggered the sell-off back then were similar to today, notably the rise of interest rates, the payment of taxes realized from the previous year's gains, thus forcing the selling of assets, expectations out of reach for some companies, and hopes of becoming rich overnight.
The IPO market was red-hot back then, with companies such as "Palm" registering triple-digit gains during their first day of trading. Today, this is not the case as the shift has focused on non-listed firms and private markets. Consequently, we believe that much of the junk is precisely on the non-listed side, where massive amounts of money were poured until recently, driving valuations of private companies to insane levels.
While not all listed companies, including recent IPOs, are guaranteed to survive, the listed stock market has done an excellent job by just not accepting everything that was coming. The best example was the failed WeWork IPO; the boom and bust of SPACs is another one. In a few quarters, the market has corrected irrational exuberance. Now there is value in some of the cratered IPOs and SPACs. We mentioned at the end of last year companies like Rocket Lab and SoFi. While their stock prices have further plummeted, their business models/end-markets and balance sheets could withstand the current storm.
We believe that the main difference between 2000 and today lies in the weighting of those companies into leading indices such as the S&P500. During the peak of the dot-com bubble, the weighting of technology companies in the S&P500 reached 35%, while their GDP contribution was low single digits. Currently, this figure stands at 28% and a 10% contribution to GDP. Furthermore, as the trillion-dollar companies in these indices represent the bulk of the total market capitalization, we believe their weightings (compared to smaller caps) are likely to diminish (in favor of smaller ones) once the market stabilizes.
Another critical factor to consider is that in 2000 the Nasdaq Composite mainly had pure technology and biotech companies as constituents. Today "only" 50% of its index is made up of pure tech companies. With this insight, we do not believe we would fall into the same patterns we saw during the implosion of the dot-com bubble as some gurus are suggesting.
Are we nearing capitulation? Consensus has never been so wrong!
The one-million-dollar question everybody would love to have answered is the following: Are we nearing the "capitulation" phase?
Many believe the market has further down legs. We saw all asset classes falling one by one. The first ones were growth strategies like ours, followed by bonds, larger caps, cryptos, and finally by larger market caps like Apple and Google. We are still missing a gold selloff as many see it as one of the best hedges against inflation. We completely disagree on this front, as the price of gold is driven by real interest rates. The more negative real interest rates are and the better for Gold, and if real interest rates keep their upward trends, it would be just a matter of time before a selloff in Gold occurs.
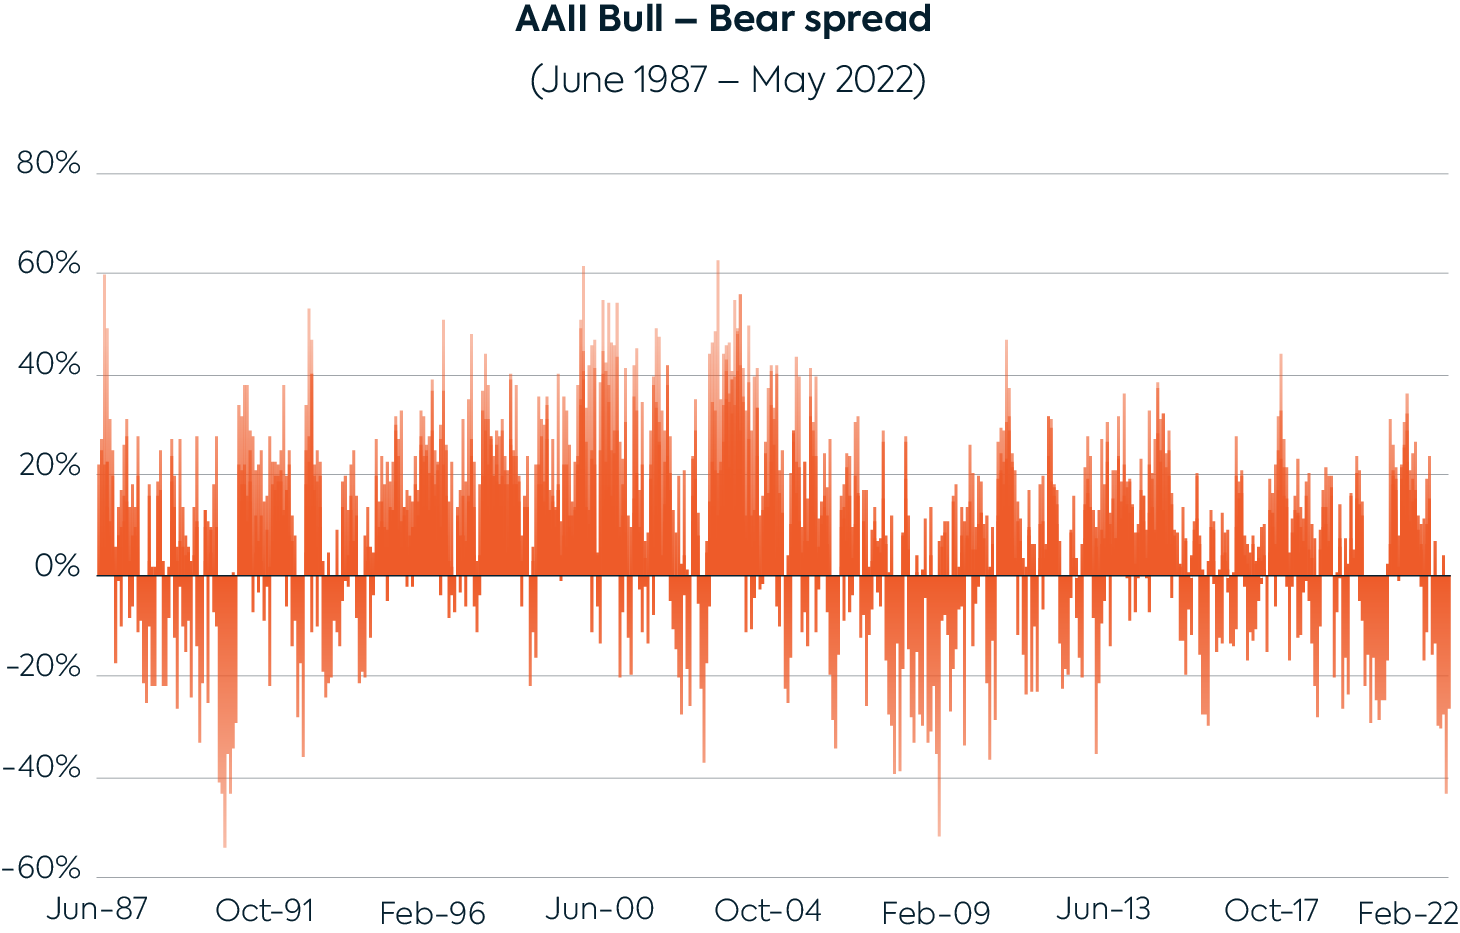
According to the American Association of Individual Investors, which publishes an investor sentiment survey, the market is at record bearishness levels. In the past 35 years, lower sentiment occurred only during the 1990 recession and at the end of March 2009. The current levels of bearishness and unwinding of all the asset classes may represent a great entry point, in the least a technical one. In other words, the rebound should start before the Fed formally changes its monetary policy.
The Covid-19 crisis squared off any forecast. While some trends (reshoring notably) were already underway before the Covid crisis erupted, most (if not all) of today's consequences are the result of the Covid-19 crisis. No one in the market (including monetary policy makers) could have correctly predicted the events that followed. No one would have bet that the economy would recover as quickly and powerfully as it did. During the height of the Covid-19 crisis, we wrote that inflation was poised to come back with a bang but failed to see the markets behaving as they currently do.
With all the above in mind, we know that the current forecasts (whether Macro or company-specific) are wrong. The markets must deal with uncertainties. The more the uncertainties, the more volatility but also opportunities. The capitulation phase during the dot-com burst occurred with the 9/11 events that were simply impossible to predict. We ask ourselves if the markets don't tell us that something of the same size is in front of us. The only thing we could see of the same size is the invasion of Taiwan or a nuclear escalation of the Ukraine-Russia conflict, which represent a significant risk for financial markets and the world's economy.
Positioning of our strategies
We stand by our central thesis, outlined in our January 2022 note: the Macro should be different in the second half of 2022. While we closely follow all events, we want to stay focused on what we do best and not change our strategies every time news comes out but concentrate on the deep trends impacting the economy.
We remain confident and convinced that the current crisis will trigger even more technology investments. Long-term investors tend to buy not when everyone does and do not unwind because of anxiety. When danger threatens us, giving in to fear is equivalent to always pressing the panic button.
We invest in innovation rather than status quo, disruptors rather than disrupted companies. In times of crisis, innovation is crucial and creates new norms and markets. Tomorrow's leading companies will be different from today's ones. We ensure that we identify the key sectors that will play a central role in the future through our top-down analysis. Should a recession materialize, the cycle's next phase will be bumpy. Capital increases, reorganizations, and eventually layoffs would monopolize the headlines. Therefore, bottom-up analysis is also more critical than ever.
We follow a very structured investment process that has allowed us to build high-quality portfolios. Earnings growth and cash-flow generation (for past and forward estimates) exceed indices and competitors. High revenue growth coupled with higher profitability, outstanding free cash flow generation, solid return on capital employed, and important addressable markets further cement our portfolios as quality-growth investments.
Our portfolios are well positioned to overcome the current turmoil and outperform in the next phase of the market.
Artificial Intelligence & Robotics
Nothing seems to slow down the revolution in digital and artificial intelligence. Despite supply chain challenges, the demand for digital and physical infrastructure has pushed the semiconductor industry to new heights. The semiconductor industry will grow sales by 2030 as much as it has increased in the last twenty years (~$400bn).
The recent earnings season confirmed massive investments in artificial intelligence infrastructure and the centrality of cloud computing. Computing chips and cloud infrastructure have played a significant role in creating value for the economy. Yet such premium may not be reflected. For instance, Baidu has developed a solid cloud business, has access to the vast Chinese market, and is rolling out world-class artificial intelligence applications such as autonomous driving, while trading at super-low levels (FY2 PE <12x, FY2 PEG <0.5x).
Additionally, automation is not just a secular trend; it is amongst the best investments companies can make during downturns, growing productivity as a competitive edge and counteracting inflation and labor shortage. Most importantly, robotization is increasing outside the industrial physical robots, rapidly addressing services (which make up ~65% of global GDP and 75%+ of U.S. GDP).
The Artificial Intelligence and Robotics portfolio has doubled down on data infrastructure players and service automation while lowering the exposure to multi-market and consumer-oriented players. We believe that all businesses will bet on digital automation. Hence, AI & Robotics might offer long-term investors a fantastic entry point and upside.
Bionics
Macro headwinds, disruptions of hospital procedures, and supply chain problems have led to a sharp sell-off in all the subsectors of the Bionics thematic. The last earnings season has confirmed our thesis that hospital procedural volumes are trending up, and supply chain challenges remain manageable so far. Meanwhile, fundamentals are improving; a record backlog, expanded reimbursement, regulatory approvals (e.g., diabetes and cancer screening sectors), and new distribution channels (including on the international front) are driving the gradual adoption of medical technologies.
We keep high exposure to sectors with limited competition and high barriers to entry (e.g., cardiovascular space) and companies that will not need to raise capital should a recession happen. These innovation-driven growth names have highly differentiated products delivering healthcare cost savings and better patient outcomes. They also benefit from higher margins and pricing power.
We believe hospitals will eventually prioritize again spending on capital equipment which drives cost efficiencies and improves hospital productivity (e.g., surgical robots). Sales of these products are expected to rebound, accelerated by the quick adoption of related disposables (a higher margin segment) and driven by higher procedural volumes and a large backlog.
To further reduce healthcare costs, nontraditional models of care (at-home and value-based care) are gaining increased acceptance among insurers and hospitals (e.g., Humana Health's recent takeover of Change Healthcare and LHC Group). Companies like Outset Medical are the primary beneficiaries of this trend. In the diabetes sector, the adoption of continuous monitoring devices and insulin pumps remains strong on the back of a market expansion (e.g., Medtronic's setback in its diabetes business, type 2 diabetes population, and hospitals), and new product launches (e.g., Dexcom's G7, Insulet's Omnipod 5).
We believe the Bionics thematic offers defensive growth even through periods of uncertainty.
Biotech 360°
Last September, we published a note on the Top 4 technologies we are convinced will drive the biotech sector. These sectors are catalyst-rich, high-beta, organic growth-oriented, and we expect them to rebound stronger than the biotech market. Therefore, we continue to increase our positions in cell therapy, protein degraders, spatial biology, and proteomics.
For cell therapies, actors harness the power of a new subset of immune cells, with excellent first results on incurable cancers. For protein degraders, a new type of small molecule, the first de-risking of the assets in the early pipelines happened for three out of the four big names; we are prepping for clinical data on efficacy, the primary catalyst for biotech stocks. Academia, the leading customer today for spatial biology, is pushing the boundaries of cell imaging and data generation on diseases. We expect Biotech to soon onboard the tech to speed up preclinical research. For proteomics, a field studying proteins, which are 90% of drug targets, the momentum is high and a reminder of the early 2000s when all the rage was to describe the entire genome: now, the target is the entire proteome.
The science behind the biotech sector is at one of its most exciting moments. Interestingly the market sentiment has never been as bleak. The main biotech index (the XBI) has experienced a drawdown like never before (~60%) since its inception; the second biggest was 49% in 2016. The current drawdown results in >20% of the U.S. listed biotech trading below cash value. At year-end 2021, 45 biotech were trading below cash value (already a record since 2007) and jumped to a record of 128 at the beginning of May. The top 15 drugmakers, on the other hand, have enough cash to buy out the whole SMID biotech sector or a whopping 644 companies with a combined value of $347bn.
While cash levels above-market caps do not indicate bargains, especially in this sector, they show the current stress and despair in the industry. Great science and depressed market sentiment are fertile soil to dig future gems.
Fintech
The current drawdown has seriously impacted new fintech companies. These companies have all the features to be in the eye of the hurricane: consumer-oriented, cyclical, in favor of top-line growth over bottom line consolidation, sometimes sensitive to the crypto ecosystem, etc. Does it mean that fintech is over? Surely not.
The financial industry is the perfect candidate for disruption (depending on legacy systems, repetitive and manual, data-driven, etc.).
Traditional banks are losing market share over challengers; consolidation in the banking sector will continue. The larger financial institutions started a new investment cycle. Increased digitization is the only way to stay afloat for legacy banks. Although we could have had less beta through old fintech companies, we focused on the long-term trends embodied by challengers as innovation accelerates because of the crisis. We are convinced that challengers will be market leaders in all financial services, such as unsecured personal loans, where they have a market share of 40-45%.
Fintech M&A activity has been intense recently. The current multiple P/E contraction has become interesting for industry players, and we would not be surprised to see other significant M&A transactions being announced soon. Why should Amazon or any large bank start a BNPL (Buy Now Pay Later) business if they can buy a leading company on the market at a discount? The latest acquisition of Black Knight by Intercontinental Exchange, with a hefty 35% premium, is the perfect example.
In addition to challengers active in lending, payments, or one-stop stores such as neobanks, our bet on the blockchain industry is no secret. The current perfect storm–Fed policy, stable coin problems, and margin calls for leveraged participants do not threaten the future developments of this ecosystem but wash–out weak hands, a perfect combination for a "cleaner" market. Investors will focus on fundamentals like technological advances, regulatory milestones, institutional appetite, and the market potential that such technology addresses.
We partially mitigate the cyclical risk by our exposure to technology enablers, mostly financial software companies. Their solutions improve efficiency and automation and should be under the spotlight in a job market under pressure.
Mobile Payments
It has been a while since we have written about the surge in mobile and digital payments adoption, as we have warned that the theme is approaching its end rather than its beginning. Early last year would have been the perfect time to close the strategy, and there is no excuse for our failure to back up our words with action.
Mobile Payments were among the first strategies to suffer severely in September 2021. We thought that the normalization of acceleration thanks to the pandemics was the critical reason for the move. The reality was a bit more complex.
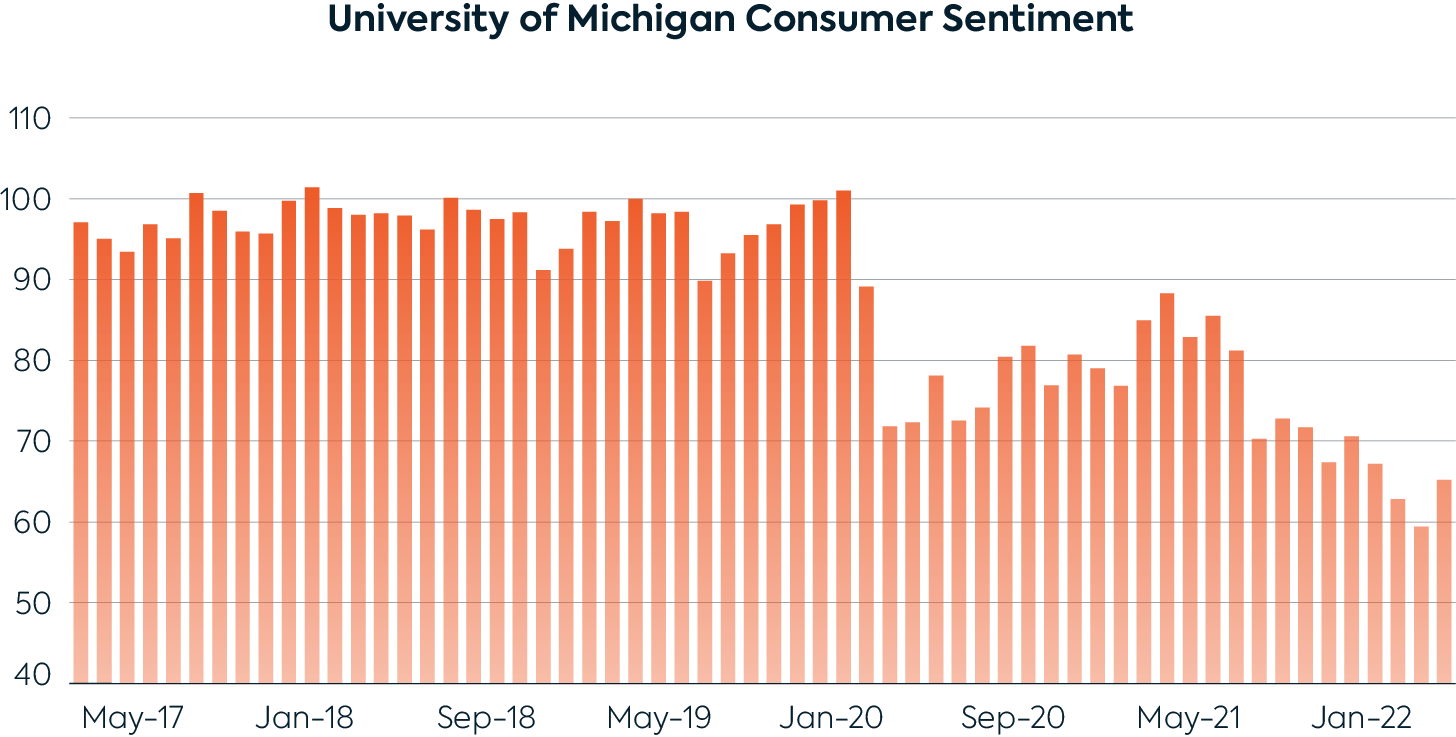
Consumer sentiment, a significant economic indicator, strongly impacts the payment industry. Consumer sentiment fell sharply since August 2021 to levels reached at the peak of the Covid-19 first wave. It also coincided with the end of subsidies of many governments to individuals and small businesses. When Mobile Payments went down, it was just the first signal that we were heading for trouble – it did not mean the theme was over.
WorldPay data about the payment mix in 2021 are finally out. What can be learned from them? The use of cash worldwide will keep falling and reach ~8% in 2024, from 26% in 2019 and 17% in 2020. The use of payment cards will remain steady in the global payment mix, going from 53% in 2021 to 50% in 2024. In other words, the total volume processed by the card networks should grow in line with global GDP growth. We reiterate our warnings on card networks, even if some investors see them as a short-term hedge against inflation.
Digital and mobile wallets will gain most of the market share lost by cash, rising from 33% in 2021 to 42% in 2022. What is most striking is the regional differences. Asia is leading the race, mainly thanks to the duopoly of Alipay and WeChat Pay in China. This might change with the deployment of e-CNY. South America has the highest growth potential as the use of cash was still close to 30% in 2021.
We would not be surprised if Mobile Payments is among the first strategies to rebound. Valuations for the whole ecosystem are depressed and could fit into a value-style strategy. Top-line growth for the portfolio is still expected to reach 20% this year, with a bottom-line growth of 50%. Margin expansions are real, at least for the payment companies we invest in, i.e., primarily challengers.
Legacy players, the mega-caps that began the industry's consolidation (already in 2017), struggle to generate double-digit growth. Even if their valuations are attractive, the risk of falling into a value trap is higher. Our exposure to these firms is currently relatively small.
The portfolio is also more diversified geographically. We aim to capture high growth in a fragmented industry where local regulations act as barriers to entry and limit the expansion to new markets. As a result, we are exposed to fast-growing South America. Finally, we also have some tactical bets, for instance, on the travel industry. As the upcoming summer holidays are booked, there could be a rebound on this segment in Q2 and Q3 that is not priced in yet, even in a global slowdown.
Mobile Payments remains an integral component of our thematic range and the atonra fund. The decision to terminate the strategy will be based on factors not yet achieved, such as a plateauing of the total addressable market and if blockchain payments were to become mainstream.
Security & Space
Ongoing market conditions have taken a heavy toll on the theme, especially as we do not invest in the Defense sector for ESG reasons. In contrast, the industry has benefited from the Ukrainian conflict. Cybersecurity companies, perceived as expensive and with questionable cost structures, have fallen from grace since their November 2021 peaks. Meanwhile, space companies have been hammered due to their early-stage profile and in the aftermath of the SPAC (Special Purpose Acquisition Company) wave implosion. However, our belief is intact about the theme's potential and our positioning.
Indeed, cybersecurity has never been a more urgent need. Our world is increasingly digitizing, yet its cyber infrastructure has never been so outdated and vulnerable, given what is at stake. This pervasive weakness paved the way for a crushing wave of cyberattacks, targeting people, companies, and institutions alike, paralyzing critical infrastructure (e.g., the Colonial pipeline), and infecting supply chains.
Infrastructures, therefore, have no choice but to adapt, especially to account for the advent of the cloud, creating new winners and losers in the process, as significant technology transitions always do. Cybersecurity has become one of the main concerns of the U.S. presidency, which will inevitably buoy a sector already displaying double-digit CAGRs despite weighting over $180bn.
On the other hand, the space sector is only at the beginning of its potential yet has firmly initiated its revolution. A new generation of private players has begun to disrupt the old glories, which are already visible in the launch segment. Applications are limitless and challenging to imagine today. However, imagery, the importance of which was reiterated by the Ukrainian conflict, or telecommunications, with LEO constellations being a game-changer for the $1.75tn telecom industry, immediately comes to mind. At the same time, space tourism has become a dream that is not so distant.
In short, while the current situation is depressing from a capital market point of view, it has never been brighter from an industrial one, suggesting that a realignment is bound to happen sooner than later.
Sustainable Future
On the one hand, high commodity prices, supply chain issues, and policy uncertainties affected our Sustainable Future strategy placing corporate margins under pressure. On the other hand, the theme's fundamentals remain solid, and with the ongoing Ukraine-Russia conflict and its impact on global energy flows, fundamentals are to strengthen.
Regaining energy security and independence by increasing the production of local energy and reducing/recycling waste is now a question of life-or-death sentence. Europe has been split on this front as it has never prepared for a B-plan. Decisions by some countries like Portugal or Spain to putting a cap on natural gas prices might be the worst thing they could do. While temporary help (in the form of checks etc.) might alleviate short-term consumer pain, more important is to tackle the root causes. If people do not feel pain, they will not act accordingly (consume less and switch to other forms of energy production) and do not change.
We believe that the current energy price crisis is perfect for many to consider energy preservation and efficiency. The portfolio thus has more exposure to segments such as heat pumps, which are likely to benefit as a source of greater efficiency. The REPowerEU plan, to be published this week, goes in the right direction. The program will be around €205 billion, should increase the target of clean energy production from 40% to 45% by 2030 and increase the target of energy consumption reduction by 50%.
The IAE (International Energy Agency) forecast that by 2026 the global renewable electricity generation is expected to rise by 50%, with solar PV representing half of it and with China leading the pack. All renewable energy projects will be boosted in the medium term, including wind, geothermal, and nuclear-based Small Modular Reactors technologies. For the short term, solar energy remains the most straightforward solution to energy independence/security, with short cycles of projects and competitive prices. While an anti-dumping investigation is currently hitting this segment, hence volatile, solar energy production will accelerate further. After cutting some exposure to solar at the beginning of 2021, we took the opportunity of the current market panic to add some exposure to this subtheme once again.
In the context of high fossil fuel prices, renewables and electrified transport have become an easy investment decision, and the sector's future growth is set to accelerate.
The risk-reward outlook
Biased towards quality-growth stock, we unyieldingly keep a watch to avoid the growth-trap stocks. In January, we presented portfolio metrics that confirmed the sound fundamentals of our stock selection. We have repeated the exercise and again reconfirmed our overall allocation towards solid revenue, earnings, and profitable businesses that do not need to tap the markets for financing constantly. It is hard to imagine that such firms will not recoup their market value losses suffered by the macro environment once the situation normalizes.
To provide more color on profitability metrics, 82% of companies (ex-Healthcare) are operationally profitable (EBITDA), and 81% are net profitable (EPS) today. We expect at least 90% of our stocks (ex-Healthcare) to be both operationally and net profitable by 2024. The number is in line with our usual portfolio construction process that favors companies with positive top-line growth and limits exposure to unprofitable businesses. Given our focus on healthcare companies at the early stage in their path to profitability, we include yet to be cash-generating therapeutic developers in our Biotech portfolio and innovative growing companies in our Bionics portfolio. This results in ~20 companies not yet profitable across our healthcare portfolios, while the remaining 60% of our healthcare stocks are about to generate profits.
Profitability pays off when the company has enough revenue growth to transfer it to earnings. The graphs below show a selection of growth metrics across time. We note a significant acceleration in free cash flow generation coupled with high revenue growth.
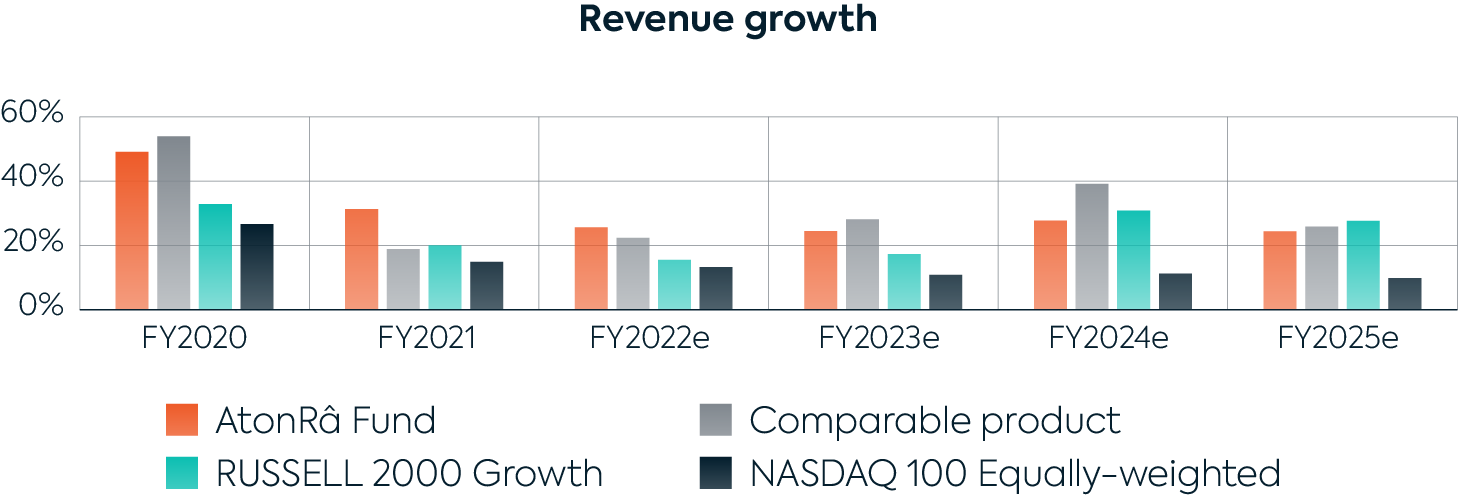
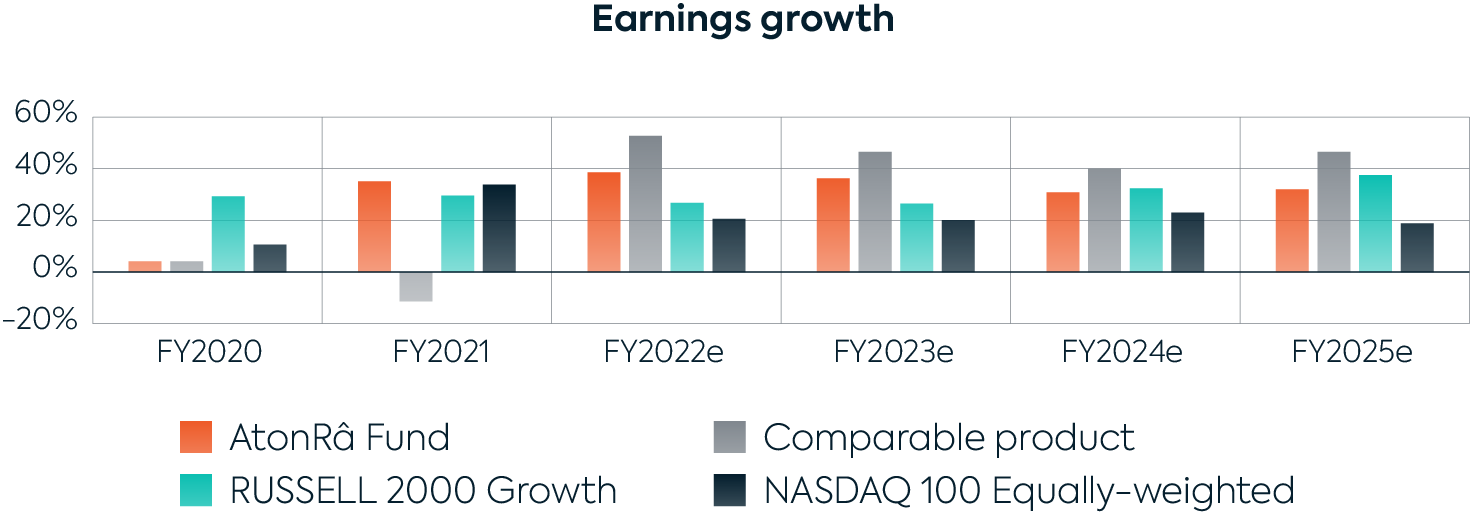


Indeed, our companies show significant growth and stellar profitability and return generation. Let's compare the ROCE (Return on Capital Employed) of the fund against its weighted average cost of capital. We confirm that the portfolio remains profitable despite the increased cost of money after the interest rate hike. This fact further strengthens our portfolios as quality-growth investments, both cash-flow generating and profitable.
This stock quality also comes at even more competitive valuation metrics than at the beginning of the year. It will be redundant to say that the recent market sell-off has pushed stocks not only to pre-Covid levels but too far in the past, given the prospects of growth.
Furthermore, we are pleased that the market implicitly agrees with our view, as three-quarters of our stocks have <5% or do not have any short interest, and only ten of our stocks show short interest at or above 15%.

Below we detail portfolio metrics for each of our themes. Investors can see how we are positioned in terms of leverage risk, valuation levels, and growth.

Indeed, the risk of leverage remains one of the most important pillars of our financial analysis and remains on par with growth and profitability. Companies with enough cash and health leverage ratios are less likely to tap the markets for funding. If their R&D or project goes awry and they do increase financing, they are less likely to significantly deteriorate their balance sheet and ongoing operations. As a result, when financing becomes difficult, these companies are best suited to withstand market shocks and market turmoil.
Across all our portfolios, ~27% of companies show a negative Net Debt/EBITDA ratio (cash positive). For 37% of companies, the ratio remains in a comfortable 0.1-4.0x range, most used in debt covenants. The interest rate coverage ratio shows that profitable companies in our portfolios can maintain their current interest payments for 99 years on average. Finally, the known Altman Z-score metric that measures the likelihood of corporate default puts only six companies at risk (and the primary source of risk is high cash use).
As you may have deduced, while the importance of interest payment sustainability is undeniable from a financial perspective, we consider the importance of having enough cash on accounts to sustain operations exponentially higher. Our rigorous testing may be found in the next section.
Evaluating bankruptcy risks
Why?
With rising interest rates, markets freefalling, and the economy slowing down, having the best technology, product, or competitive positioning is not enough. All this is useless if the company's balance sheet is not solid enough to withstand an indefinite drought.
Atonra's expertise has constantly been about identifying tomorrow's technologies and then investing in companies that will become winners and capture the corresponding growth. Although we focus on investing in quality growth stocks, current market conditions have driven us to conduct an even deeper financial analysis of our portfolio, specifically focusing on our company's cash burn. The basic idea of the exercise is to assess the risks of running out of cash, given that deteriorating market conditions can complicate refinancing, either through debt or equity. For this, we followed a straightforward approach.
How did we proceed?
We first considered two primary metrics: the Operating Cash Flow burn and the Free Cash Flow burn. Indeed, considering only the Free Cash Flow would deny management a possibility of temporarily cutting into capex while waiting for the storm to end. Although we believe that investments and innovation are of utmost importance, as they are the core enabler of future profits, sometimes it takes what it takes to survive. A bankrupt company will never have a chance to invest in anything again.
Assessing our companies' strength can be as simple as dividing cash reserves by the last cash burn, effectively giving the number of months/years before running out of cash at the current spending rate. However, this would hide the potential improvement/deterioration of a financial situation and expose us to the risk of calculating cash burns based on statistical anomalies. Therefore, in addition to making our calculations with the latest economic data, we also computed a "historical average EBITDA-relative cash burn." The number represents a percentage of cash burn relative to the EBITDA over the last three years, applied to the most recent EBITDA. Doing so would allow establishing some "normative cash burn" and highlight structural changes in case of differences with the latest data.
In the end, we retained the following criteria:
- According to any of the two metrics, a company is flagged as potentially in danger if it has three years or less of cash reserves.
- We red flag any deterioration, i.e., if the latest cash-burn figure is worse than the computed 3y average. In this case, we raise the cap to 4 years of cash reserve instead of 3 years.
This leaves us with a first shortlist of 32 (out of 161) companies across all our strategies, potentially at risk, accounting for ~16% of the AtonRâ Fund. A list of names with corresponding cash burn figures is provided in the following section.
What are our findings?

Two themes account for most of the list, namely Biotech (12 names) and Sustainable Future (8 names), while there is no single name from AI & Robotics.
Several points are worth mentioning:
- According to the operating cash burn in the Biotech portfolio, only three names have less than three years of reserves, and a fourth can be added to the list when considering the free cash burn. However, the cash-burn figures are closer to three years than two years for the two companies. This only leaves Madrigal Pharmaceuticals and Intra Cellular Therapies with cash reserves below two years. What is more worrisome is that the little spread between the two metrics means there is a little leeway for the companies to adjust free cash by decreasing capex. Moreover, according to the projected free cash burn, Intra Cellular's cash reserves are dangerously low (barely enough to sustain six months of operations).
- In addition, despite cash reserves above three years, Catalent, Kymera, Nurix Therapeutics, and Seattle genetics should also be carefully monitored, as they are entering investment phases that will mechanically impact their cash-burn rates: Catalent is investing in next-gen manufacturing, Kymera and Nurix are entering the clinical trials phase, the most expensive phase for any pharma. Only for Seattle Genetics the trend may be somewhat worrisome.
- In the Sustainable Future portfolio, what stands out is the difference between operating cash-burn and free cash-burn. Four of the eight names show no operating cash burn, suggesting capex-intensive business models that could shelter themselves should a financial storm happen. Out of the four remaining companies, Nel and Wolfspeed have comfortable reserves, and although their free cash-burn profile is deteriorating, the shift seems limited or manageable. Sunpower appears to have quite improved its financial profile, as the latest data is much better than the projected historical average. This only leaves Sunrun in a precarious state.
- Although the two Security & Space companies (Astra Space and Virgin Galactic) have limited reserves, both have recently heavily invested in their business and infrastructure, suggesting that they can now focus on improving their efficiency. Virgin Galactic seems the most at risk, although it can rely on its order book and has yet to transition towards the intensive commercial phase, suggesting it can start regular operations with existing assets.
- In Fintech, Riot Blockchain and Marathon Digital have comfortable capex leeway. Although investments are critical to remaining competitive in its segment, Riot's free cash burn leaves two years of reserves, something not essential in our view. At the same time, the situation may be more precarious for Marathon. Ncino appears to have sufficient reserves, despite signs of deterioration. Nu Holdings' reserves, on the other hand, appear to be dangerously low, but the company's business grew exponentially last year, draining liquidity. As a financial conglomerate, Nu must comply with capital requirements. At the end of 2021, its capital adequacy ratio was 22.6%, well above that of large banks in developed countries or Basel III requirements.
- In Mobile Payment, Pagseguro is above our 3-year threshold but has a deteriorating profile, which we closely monitor.
- Finally, most Bionics names are close to or above our 3-year threshold, suggesting that the cash cushion is not ideal but not dangerously thin either. The notable exception is Exact Sciences, but its financial profile appears to have improved quite substantially.
Our analysis, therefore, leads to three companies being in a potentially problematic situation, Intra Cellular Therapies, Madrigal Pharmaceuticals, and Sunrun. Nu Holdings also appears fragile, but rather due to its business faring "too well," something more manageable to fix than the opposite. These four stocks account for 1.7% of our holdings.
Digging deeper: let's go stress-test
It seemed interesting for us to submit our portfolio to a stress test to push the process further. Our modus operandi was straightforward:
- calculate a cost structure between the top-line and the EBITDA;
- cut the latest available revenue by a whopping 20% to simulate a significant crisis.
- Apply the same cost basis on this new revenue and observe the impact on the cash conversion based on the projected historical average previously calculated. This implies neither adjustment of the cost structure nor capex cuts, which would, of course, occur should this situation arise for real.
The results are synthesized in the following charts, with the companies' weights being grouped by theme.
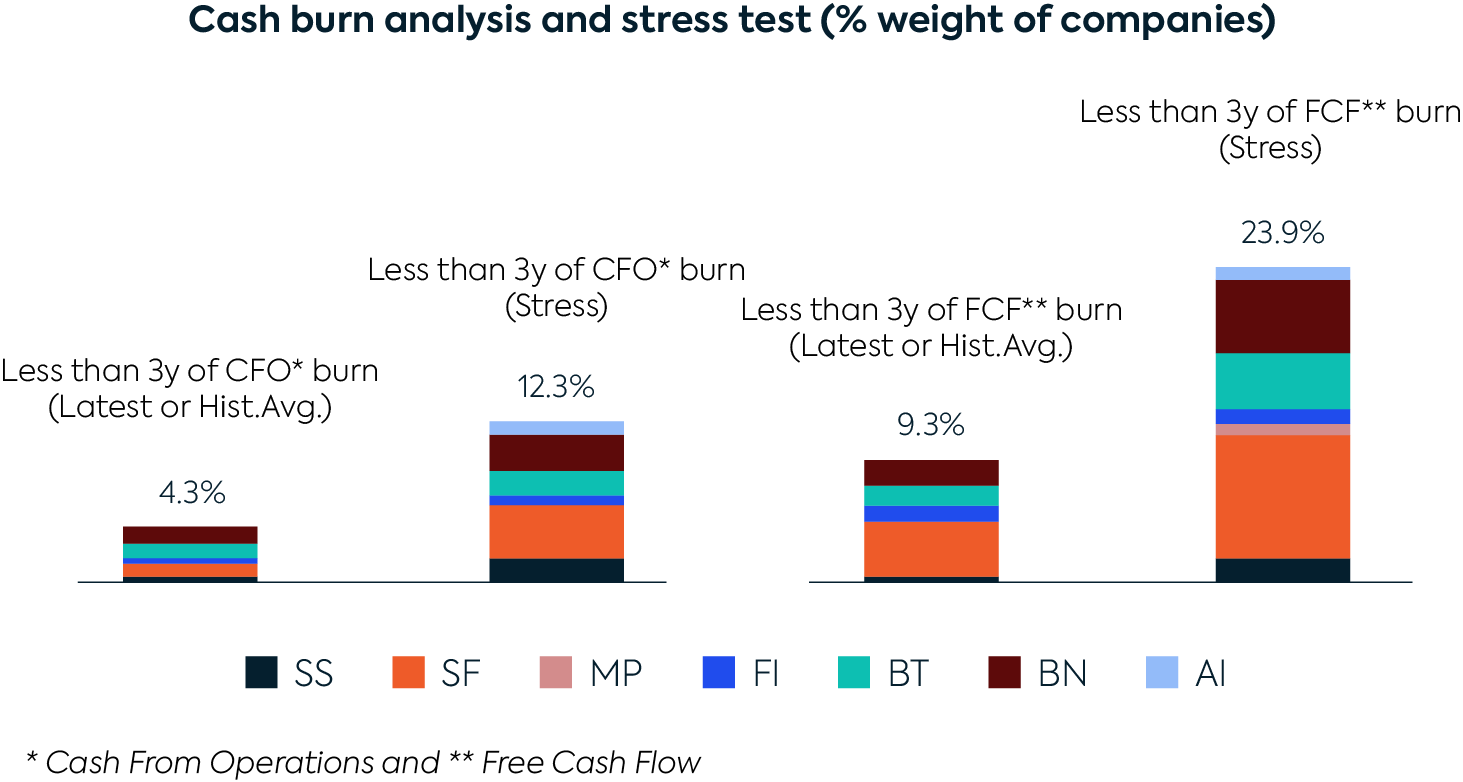
What stands out is that the overall percentage of companies falling below the 3-year threshold remains limited, especially for the operating cash flow, which is, in our view, the primary metric to observe: overall, less than 15% of our portfolio would become at risk. The FCF (Free Cash Flow) figure is higher, but the delta between the two metrics leaves plenty of room at the capex level. Finally, it is interesting that ~10% of the portfolio falling below the 3-year FCF threshold is not burning cash outside the stress-test context.
Lessons from the consensus
The following charts highlight that the situation is not homogeneous regarding consensus estimates. A high percentage of analysts have cut their estimates in Biotech, Fintech, and Mobile Payments, are more neutral on Bionics and Sustainable Future, and remain frankly bullish in Artificial Intelligence & Robotics and Security & Space. This suggests that estimates on the former may already be purged and that such a reset remains to be seen on the latter unless analysts have correctly interpreted the market potential of their coverage.
.png)
.png)
.png)
.png)
.png)
.png)
.png)
.png)
The consensus of the EPS in the following graphs tells an exciting story. Full-year EPS revisions are primarily stable or on the rise, while next-quarter revisions are the opposite, suggesting pessimism over the short term before a rebound shortly after.
.png)
.png)
.png)
.png)
Most interestingly, it suggests a polarization of the consensus: many analysts have made limited downgrades, and a low proportion have made important ones. Indeed, an average earnings downgrade for stocks in our portfolios is -4.4% for the next quarter and -17.1% for the whole year, while the upgrade average is +40.5% and +26.3%, respectively. Revenue up-/down-grade was much more stable and less polarizing: -1.8% vs. +1.4% for the next quarter and -4.4% vs. +8.7% for the entire year. Interestingly, not considering outliers in the biotech portfolio, companies revised revenue guidance for FY2022 by +4.7%.
This suggests a high potential for earning surprise, which could unfold positively or negatively. A more prosaic conclusion would be that visibility has become extremely limited, suggesting a period of high volatility.
Our Takeaway
We are in the middle of the storm but could see some light at the end of the tunnel.
Looking at valuations, the NASDAQ hovered between 12x P/E at its lowest levels during the 2008 financial crisis and 70x at the heights of the dot-com bubble. Today it is trading at 25x FY23, which is in line with historical averages of 26x and compares to 30x before Covid and 40x during Covid.
The different portfolios that we manage have sound fundamentals and trade at cheaper valuations than the NASDAQ on a PE/Growth basis. Most of our portfolios (except for Bionics) are trading at 1.1x on average vs. 1.7x for the NASDAQ. The market is overpaying visibility and earning stability, which in the current context is entirely understandable.
There is little leverage in listed equities markets, and we are at the opposite of what did happen during the dot-com bubble. For private markets, it’s a bit different given the recent hype. Still, as investors are stuck with their investments for a longer period, the only way they have to raise cash, if needed, is by selling other assets on listed markets, further pushing down the markets for liquidity reasons.
While a recession might be unavoidable in the following quarters, the steep rise in interest rates might not be as severe as the market expects once supply-chain issues adjust. Furthermore, the high wholesale inventory number points to less stress on the availability of goods. What would happen once the flow of goods restores and becomes normal again?
Finally, If the housing bubble comes down, inflation pressure would certainly abate, and the Fed would have done a great job tempering the strong demand side of the equation.
While we don’t have a crystal ball, we believe that the current situation represents an excellent opportunity for long-term investors to seize on the cheap side investment opportunities that will shape our future.

